Thursday, August 19, 2010

Insuffiently detailed isochrones

So, the reason the -log likelihood wasn't being calculated correctly dealt with the step size in the isochone. The difference between one isochrone point and the next on the main sequence can be several tenths of a magnitude and larger than the photometric error. Therefore this influences the probability. Getting stars near isochrone points is just as important as getting stars on the general shape of the isochrone.

In order to combat this problem, I linearly interpolated between neighboring points to create two new points at one third intervals between the original points. This hopefully will not introduce too much error because of the small range over which I am performing the calculation. I checked the Y2 isochrones, and they had an even worse grid. I may still search for another, better isochrone source.

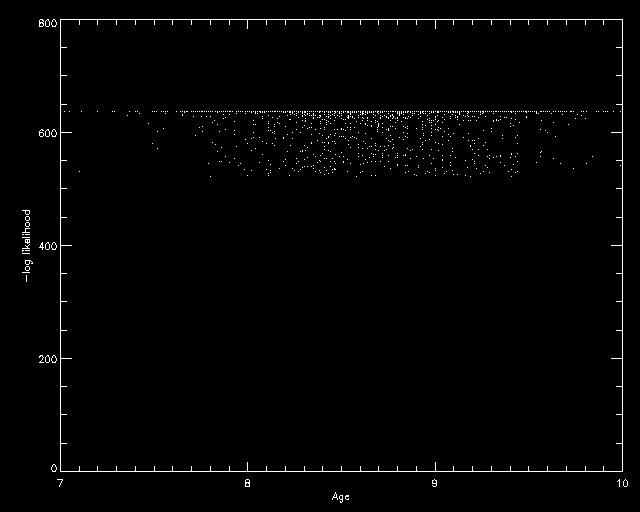
While it now centers around the predicted age, an actual peak doens't really exist. Seems like there is a minimum -log likelihood value, that cuts of under. This is my next problem to fix.

And congratulations to Mary on a beautiful presentation :)

Wednesday, August 18, 2010

No Progress


So, I still have not figured out why my program highly favors really young ages and ignores the turn off and red clump. Obviously the Cross Entropy framework is fine since it worked so well for distance moduli, as you can see the plot of all moduli from the parameters sets versus the corresponding -log likelihood. Yet a lower age always allows a better fit?

I created fake stardata just out of the points from an isochrone, and then it didn't go to zero, but it still undershot. I do not understand what that test might suggest.

Anyway, I believe it is NOT as a result of the membership probability, or the CE framework, the IMF, how I am marginalizing over mass, a mess up in dimensions, how I read in the grid, the few outliers, or how I'm weighing the average of the best points by 1/-log likelihood,

Tuesday, August 17, 2010

TARGET GOAL REACHED and code still frustrating

I have listed 100 targets, my goal.
Well, I should actually cut a few of those out for being too far south, but I'm basically there. How far south can I go?

Also, my code does not quickly send the cluster parameters to zero after a few iterations anymore. Typo in calculating the averages. Also, I can't use ASCC-2.5 data. Even though Kharchenko et al 2005 did, I don't see actual cluster like features on the CMD.
Though those mistakes are eliminated, I can't seem to get the proper values. The main sequence gets fit quite nicely, but it completely ignores the turn-off and the red clump. Especially since NGC2099 has a nicely defined red clump, what happens when it is sparse or non-existent?

Monday, August 16, 2010

WEBDA mistake?

So the age quoted for NGC2204 in WEBDA is completely wrong. It doesn't fit the data. The most recently published value, which does fit the data, is different by almost one entire Giga-year.

Also, their UBV color magnitude diagram is different from the one the data gives.

This is not a cluster I could use, but I think I should still report the inconsistencies. Not sure how though.

Also for NGC2818, the photoelectric data is mildly consistent with the parameters, but the CCD is just not. Where I found published parameters, they agreed with WEBDA's values that don't fit.

Thursday, August 12, 2010

Membership Determination Problems

So the majority of today has been trying to get my membership probability calculating program to work. It's now giving resonable numbers, though I believe I'm actually fundamentally misunderstanding basic statistics and completely messing up.

So I'm using distance from cluster center, and RA/ DEC proper motions as given by ASCC-2.5. So, the probability of a data is just the value of the Gaussian at that point. But when I see membership probabilities in WEBDA, they seem much higher. How do they get a 98% membership probability if the peak 1/sqrt(2pi)*sigma is less than that. And other places speak of 67% chance as a 1-sigma confidence interval. Being 1-sigma away from the mean doesn't mean the value of the Gaussian is 67%. And doesn't a PDF only start having meaning when you integrate and say the probability of something between two values?

So I was thinking along the integration lines, and started computing the probability by measuring what percentage of the PDF it was better than. Something in the center has 1 and at infinity has zero. Though I guess 1-sigma is then 33% not 67%. I don't know.

Also, how do I bring together three different probability sources. No matter how good a star is, multiplying them, which follows formulaic logic, is going to lower its probability. The new data will confirm that its a good point, but the probability will go down.

I feel like I should understand this stuff.

On the bright side, I started running a basic level of the code earlier when I left Cahill, and will check it in the morning. I only need to decide on the metalicity grid to add that dimension, which should be finished tomorrow. I also want to get a specific book about Cross Entropy from the library to research parameter tuning.

After I finish those details, I need to figure out bootstrapping and implement that. I don't understand bootstrapping yet, but it shouldn't take too long to master. To finish, I will test the program's efficiency. My plans to test efficiency include creating a synthetic cluster and attempting to retrieve input parameters. Also, I want to determine the influence of binary population, use of weights, IMF, smoothing parameters, and isochrones source (Padova etc.) on the output. I plan to finish this all next week and get started on the mass fitting protocol. The mass fitting protocol should be simple when compared to this process.

Finishing those, I only need to run clusters through the code pipeline and get back masses. Clusters with previously unpublished values can also be calculated and possibly included in the survey. I believe I will be able to get the necessary stars.

Oh- and I'm writing my second progress report this weekend.
Wednesday, August 11, 2010

Small victories and Weighting Plan

I have now created my smeared gauusians and developed a way to import grids into idl variables :)

I have also decided on a plan of action for the "weighting". It served the purpose to decide cluster membership, so I will proceed to take into account cluster membership according to a Bayesian approach.
Let X= parameters of cluster and Prob(member|X) be A

Prob(Data| X )=Prob(D, member | X) + Prob(D, non-member |X)
=Prob(member| X)*Prob(D | member, X) + Prob(non-member|X)*Prob(D | non-member,X)
=A*Prob(D|member,x) + (1-A)/[(Vmax-Vmin)*(Bmax-Bmin)*(Umax-Umin)]

The last step follows from the probability being independent of the parameters and uniform over the parameter space. The size of the parameter space will be determined by the span of the data.

Though adding complication, I will follow a process to determine A similar to that of Kharchenko et al 2005. Solving my problem of uniform data set, I will use ASCC-2.5 data. I may limit that data source to those clusters with distance moduli less than 11 to keep a wider range of main sequence above the 14 magnitude limit. I will model location and proper motion (parrallax for closer clusters too), and determine membership probabilities based of the dispersion in those values.

Tuesday, August 10, 2010

Eliminating Pre-Conceived Notions

Even though we have errors in only magnitudes and isochrone data in magnitudes, and my code if fact fits in magnitude-magnitude space, for some reason I and many other papers still primarily think and speak of color-magnitude space. I need to change my thought process to focus around magnitude-magnitude (Magnitude^3 when including U) space.

This means the binary fraction also introduces errors in U and B. I am near completing the protocol for computing probabilities accounting for a binary population.

I am also doubtful as to my need to factor in the initial mass function. Does it put unproductive weight on lower stars?

As to the weighting topic, I am trying to determine the Bayesian logic behind assigning a weight. I am thinking the logic behind it deals with the certainty which we believe the star came from the cluster. If a star is in an un-populated region on the CMD and away from the isochrone, the probability quickly drops to zero and is barely effected by changes is the parameters, so it does not have any importance anyway.

I am also trying to understand working with three dimensional arrays to eliminate a for-loop. My brain does not like wrapping itself around what I need to do. I have read some good tutorials and believe I will manage it soon.